What 142,386 GPS Points Know About My Trip, and What They Don't
From 10 to 12 October 2026 I travelled through Shikoku on a three-day JR pass. My phone logged everything in the background: 142,386 GPS points, 67,539 steps, 66 places where I stopped, 78 legs of movement and 55 weather readings. Afterwards I asked an AI to read the export the way a data analyst would, one step at a time.
It got almost every number right. It also got two of the stories wrong, and the way it got them wrong taught me more than the numbers did.
715 kilometres, and a question of how you count
The export splits every movement into a mode of transport. Measured by distance, this was a train trip: more than nine kilometres in every ten went by rail or bus.
| Mode | Distance | Time moving | Mean speed | Peak speed |
|---|---|---|---|---|
| JR rail / bus | 657.9 km | 13.2 h | 52.2 km/h | 87.9 km/h |
| Walking / hiking | 47.9 km | 12.8 h | 4.0 km/h | 12.3 km/h |
| Bicycle | 9.0 km | 0.8 h | 11.2 km/h | 15.3 km/h |
| Total | 715.4 km | 27.0 h |
Measured by time, it was something else. I spent 13.2 hours on trains and buses and 12.8 hours on my feet. Almost half of the time I was moving, I was walking. The same table describes a train holiday or a walking holiday depending on which column you read first.
The pedometer says it was a hike
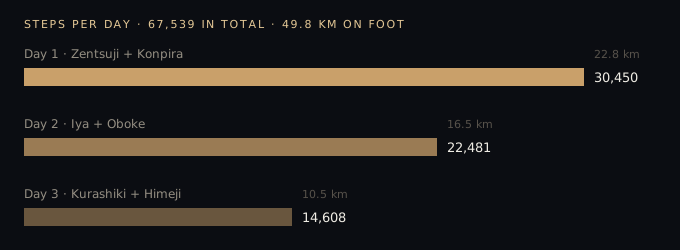
Day 1 alone was 30,450 steps, 22.8 km: further than a half marathon, between the udon shop in Zentsuji, the summit of Kōshikizan behind the temple, and the long stone stairs of Konpira-san. Over three days the pedometer counted 49.8 km, more than a full marathon, on a trip I had planned as slow. The daily totals fall steadily, 30,000 to 22,000 to 15,000, which is probably the most honest line in the whole dataset: I got tired.
556 metres, and the first wrong story
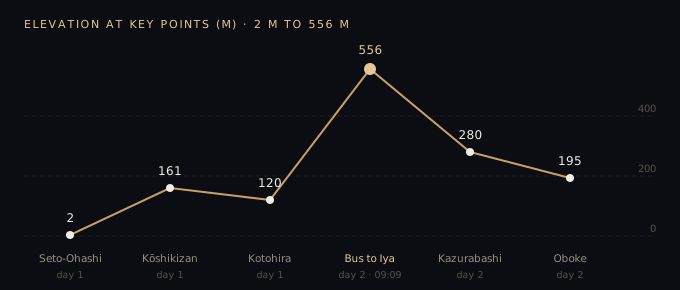
The highest point of the trip was 556.4 m, at 09:09 on the second morning. The lowest was 2 m, on the Seto-Ohashi Bridge over the sea. The analysis placed the peak on the Nanpu limited express, crossing the mountains into Tokushima.
My camera roll disagrees. The train reached Oboke at 08:47. At 08:58 I filmed the bus pulling in, and at 09:12 I was filming forest through its window. At 09:09 I was on the bus winding up towards the vine bridge at Iya Kazurabashi, not on a train. The data had the altitude right and the time right. It inferred the wrong vehicle, because "train" was the most likely answer for that part of the route.
The gratin, and the second wrong story
On the afternoon of day 2 the data shows a 25-minute stop at Awa-Ikeda station, from 16:05 to 16:30, and a meal from the 7-Eleven: a warm gratin. My original plan had lunch at a soba restaurant. The analysis connected those facts into a neat story: I skipped the sit-down meal to make a train connection, a small trade of comfort for speed.
That is not what happened. I spent far longer walking Oboke Gorge than I had planned. My own video clips there run from 12:06 to 13:26. By the time I came back it was late, the shop I had in mind was closed, and Oboke station had nothing left to eat. The gratin was not a choice made for efficiency. It was simply what was still open.
There is a detail in the data that hints at this, if you know where to look. The 66 stops include only 31 minutes at the gorge viewpoints, because a stop is counted only when you stand still. An hour of slow walking along a river doesn't register as a stay at all; it disappears into a movement leg. The part of the day that mattered most to me is close to invisible in the summary.
The data knew where I stood and for how long. It could not know that I lost track of time by a river.
What I take from it
GPS data records behaviour: position, speed, duration. It does not record reasons. When a system is asked to explain behaviour, it fills the gap with the most plausible reason, and plausible is not the same as true. Both mistakes here had the same shape: the facts were correct and the story connecting them was invented. Each invented story was more efficient and more tidy than the real one.
This is the same lesson I keep running into in machine learning work. A model can be precise about what happened and confidently wrong about why. The check that caught both errors was not a better model. It was a second, independent source: the videos on my phone, with their own timestamps, and my own memory of the day. In practical terms, before you trust an explanation, find one piece of evidence that wasn't produced by the same system that made the explanation.
And one small, personal result. The numbers say this was a fast, high-effort trip, with 715 km and a marathon on foot. The film I made from it is slow and quiet. Both are true. The data measured how far I went. It had no way to measure how long I stood still and listened.
142,386のGPSポイントが知っていること、知らないこと
2026年10月10日から12日まで、JRの3日間パスで四国を旅しました。その間、スマートフォンはバックグラウンドですべてを記録していました。GPSポイント142,386件、歩数67,539歩、立ち寄った場所66か所、移動区間78本、天気の記録55件です。旅のあと、このデータをAIに渡し、データアナリストのように一歩ずつ読み解いてもらいました。
数字はほぼすべて正確でした。一方で、2つのストーリーは間違っていました。そして、その間違え方のほうが、数字そのものより多くのことを教えてくれました。
715キロ、そして数え方の問題
データは移動のひとつひとつを交通手段ごとに分けています。距離で見れば、これは鉄道の旅でした。移動距離の9割以上が電車かバスです。
| 手段 | 距離 | 移動時間 | 平均速度 | 最高速度 |
|---|---|---|---|---|
| JR・バス | 657.9 km | 13.2 時間 | 52.2 km/h | 87.9 km/h |
| 徒歩・ハイキング | 47.9 km | 12.8 時間 | 4.0 km/h | 12.3 km/h |
| 自転車 | 9.0 km | 0.8 時間 | 11.2 km/h | 15.3 km/h |
| 合計 | 715.4 km | 27.0 時間 |
時間で見ると、まったく違う旅になります。電車とバスに乗っていたのは13.2時間、歩いていたのは12.8時間。移動していた時間のほぼ半分は、自分の足で歩いていました。同じ表が、どの列を先に読むかによって「電車の旅」にも「歩く旅」にもなります。
歩数計が語るのは、ハイキングだった
1日目だけで30,450歩、22.8 km。善通寺のうどん屋から、お寺の裏の香色山の山頂、そして金刀比羅宮の長い石段まで、ハーフマラソン以上の距離です。3日間の合計は49.8 km。「ゆっくり旅する」つもりの旅で、フルマラソン以上を歩いていました。1日ごとの歩数は3万、2万2千、1万5千と下がっていきます。おそらくこれが、このデータの中でいちばん正直な線です。疲れていたのです。
556メートル、そしてひとつめの間違い
旅の最高地点は556.4 m、2日目の朝9時9分でした。最低地点は海の上、瀬戸大橋の2 mです。分析では、この最高地点を特急「南風」で山を越えて徳島に入る区間だとしていました。
ところが、カメラロールの記録は違います。電車が大歩危に着いたのは8時47分。8時58分にはバスが着くところを撮っていて、9時12分にはその窓から森を撮っていました。9時9分の私は、電車ではなく、祖谷のかずら橋へ向かう山道をバスで上っていたのです。データは標高も時刻も正しかった。ただ、その区間で最もありそうな答えが「電車」だったため、乗り物を推測で間違えたのです。
グラタン、そしてふたつめの間違い
2日目の午後、データには阿波池田駅での25分間の滞在(16時05分〜16時30分)と、セブン-イレブンの温かいグラタンが記録されています。最初の計画では、昼食はそば屋の予定でした。分析はこれらをつなげて、きれいな話を作りました。乗り継ぎに間に合わせるために座って食べる食事をあきらめた、快適さとスピードの小さな取引だ、と。
実際は違います。私は大歩危峡を、予定よりはるかに長く歩いていました。そこで撮った動画は12時06分から13時26分まで続いています。戻ったときにはもう遅く、行くつもりだった店は閉まっていて、大歩危駅には食べるものが何も残っていませんでした。グラタンは効率のための選択ではなく、まだ開いていた店にあったもの、ただそれだけでした。
見る場所を知っていれば、データにもそのヒントはあります。66か所の立ち寄り先のうち、峡谷の展望地での滞在はわずか31分。立ち寄りとして数えられるのは立ち止まっているときだけだからです。川沿いをゆっくり歩いた1時間は、滞在としてはまったく記録されず、移動区間の中に消えてしまいます。私にとってその日いちばん大切だった時間が、集計の中ではほとんど見えないのです。
データは、私がどこに、どれだけいたかを知っていた。川のそばで時間を忘れていたことは、知りようがなかった。
ここから持ち帰ること
GPSデータが記録するのは行動、つまり位置と速度と時間です。理由は記録されません。行動の説明を求められたシステムは、その空白をいちばんもっともらしい理由で埋めます。けれど、もっともらしいことと本当のことは同じではありません。今回の2つの間違いは同じ形をしていました。事実は正しく、それをつなぐストーリーが作られたものだった。そして、どちらの作り話も、実際よりも効率的で、きれいに整っていました。
これは、機械学習の仕事で何度も出会う教訓と同じです。モデルは「何が起きたか」については正確でも、「なぜ起きたか」については自信満々に間違えることがあります。今回の2つの間違いを見つけたのは、より良いモデルではありませんでした。独立したもうひとつの情報源、つまり自分のタイムスタンプを持つスマートフォンの動画と、その日の自分の記憶です。実践的に言えば、説明を信じる前に、その説明を作ったのと同じシステムから出てきたのではない証拠を、ひとつ探すことです。
最後に、小さな個人的な結果をひとつ。数字が語るのは、715 kmとフルマラソン分の徒歩という、速くて体力を使う旅です。けれど、この旅から作った映像は、ゆっくりで静かです。どちらも本当です。データは、私がどれだけ遠くまで行ったかを測っていました。どれだけ長く立ち止まって耳を澄ましていたかは、測りようがなかったのです。