Why Predictive Maintenance Models Fail Without Domain Constraints
A machine learning engineer trained a Random Forest classifier to flag developing faults across a fleet of sensors. The model returned a number that looked like 94.4% accuracy. Everyone was pleased — until someone asked: how many real failures did the model actually find?
The answer, buried inside the classification report, was almost none.
| Class | Precision | Recall | F1-score | Support |
|---|---|---|---|---|
| 0 (normal) | 0.985 | 0.958 | 0.971 | 77,851 |
| 1 (fault A) | 0.003 | 0.013 | 0.005 | 707 |
| 2 (fault B) | 0.000 | 0.000 | 0.000 | 450 |
| accuracy | 0.944 | 79,008 | ||
| macro avg | 0.329 | 0.323 | 0.326 | 79,008 |
| weighted avg | 0.971 | 0.944 | 0.957 | 79,008 |
The two summary rows at the bottom make the gap explicit. Macro avg treats all three classes as equally important regardless of how many examples each one has, and it comes out at 0.326. Weighted avg scales each class's score by how often it appears in the data, so it comes out at 0.957 — almost entirely reflecting the normal class. The overall accuracy of 94.4% is closer to that second number's story than the first, which is exactly the problem.
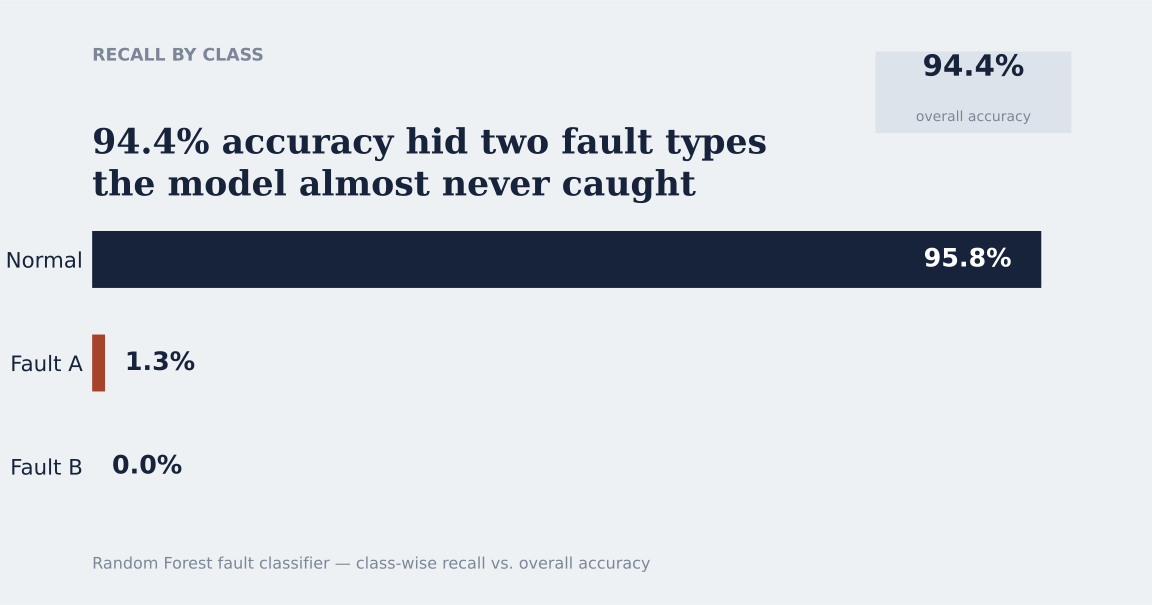
The model learned that predicting "normal" almost every time is a low-risk strategy when 98% of the training data was in a healthy operating condition. It achieved 94.4% accuracy by being nearly right about the majority class and almost completely wrong about the minority classes — the very ones the system exists to catch. That's neither a coding mistake nor a model mistake. It's a modeling decision made with no domain context attached, and it's one of the most common ways predictive maintenance projects fail quietly, even when the headline result looks appealing.
Accuracy lies when failures are rare.
By its nature, predictive maintenance produces imbalanced data, because machines spend most of their operating time healthy. From a production and reliability standpoint, failures must be rare events — which means that looking at accuracy alone results in a model that can ignore failures entirely and still score well.
The algorithm must arrive after domain knowledge and its framing. In an imbalanced dataset like this, precision-recall AUC is more honest than ROC-AUC, because ROC-AUC is inflated by the large pool of true negatives — readings correctly identified as normal — which can look deceptively strong even when the model is missing most of the true faults. Beyond the choice of evaluation metric, the deeper question is one only domain knowledge can answer: what does a false alarm cost compared to a missed failure, or vice versa? In most maintenance contexts, a missed failure means secondary damage, loss, and unplanned downtime, while a false alarm means an inspection that turns up nothing. That asymmetry is the reason to optimize recall on the failure classes — using an F2 score — rather than treating precision and recall as equally important.
Only domain experts can supply that cost ratio. No metric library can tell you.
The algorithm should follow the question, not the trend.
Forecasting a continuous variable, detecting an outlier in unlabeled data, and classifying a labeled fault are three different problems, and it's worth being precise about which tool belongs to which job:
| Algorithm | What it does |
|---|---|
| ARIMA | Classical statistical model for forecasting the value of a time series from its own autocorrelation structure — it answers "what will the signal do next," not "is this reading anomalous." |
| Mahalanobis distance | Statistical distance measure that accounts for correlation between variables, used to flag multivariate outliers rather than forecast anything; doesn't need a labeled dataset. |
| Random Forest | Supervised ensemble method that needs labeled examples — fault and no-fault — to learn from, which is exactly the resource that's scarce in the report above. |
| DBSCAN | Unsupervised, density-based clustering algorithm that requires dense regions of normal operation and marks sparse, isolated points as noise — useful for anomaly detection when labeled failures are too rare to train a classifier reliably. |
| RNNs (incl. LSTM & GRU) | Neural network architectures that capture temporal dependencies in sequential sensor data. |
| Prophet & NeuralProphet | Forecasting frameworks designed for time series with trend and seasonality; NeuralProphet extends Prophet's additive model with neural-network components. |
Treating the table above as a menu of interchangeable "predictable algorithms," and picking whichever performs best on a held-out problem, skips the step that actually determines whether the result means anything. Knowing whether you have an unlabeled anomaly problem, a forecasting problem, or a labeled classification problem comes first — and that distinction comes from understanding the failure you're trying to catch, not from an algorithm's popularity.
Let physical meaning drive feature engineering.
Choosing the right statistic — mean, median, standard deviation, and so on — to build a feature isn't a matter of convention; it depends on how the underlying physical signal behaves. Pressure, for instance, can sit inside its normal range even as a compressor valve begins to degrade, because faults usually show up first as increased fluctuation rather than a shift in the average. In that case, the standard deviation or variance of the pressure signal over a rolling window carries more diagnostic information than the mean, since it captures instability that averaging would smooth away. The pressure differential across a filter or heat exchanger is often more useful still, because a rising delta-P as the component clogs is a direct physical indicator of degradation, independent of the absolute pressure level. Temperature behaves differently again: because ambient conditions and load vary, the absolute reading is a noisy indicator on its own, but the rate of change, dT/dt, computed over a rolling window, can flag a developing fault before the absolute value ever crosses a fixed threshold. Getting this wrong weakens the model and smooths away the exact signal it was built to detect.
Constraints simplify the solution more often than they complicate it.
A complex model has very little true signal to learn from when failure examples number in the tens against a dataset of tens of thousands of healthy readings — and plenty of room to overfit to noise. In a data-rich field, the instinct is to reach for the most capable model available. Under these conditions, domain-grounded approaches — pressure-differential thresholds drawn from a manufacturer's spec sheet, knowledge of the environment the system operates in, or a physics-based thermal-degradation model — can outperform a black-box classifier while requiring a fraction of the data and compute. They also produce something people can act on with confidence, because the reasoning behind an alarm is traceable to a known physical mechanism rather than a decision boundary learned from an imbalanced dataset.
None of this argues against machine learning, or against any particular algorithm, for predictive maintenance. It argues against deploying an algorithm without the constraints that make its output trustworthy: the right problem framing, an evaluation metric that matches the cost structure involved, and features grounded in what the signal physically represents.
Before you trust a model, ask these three questions.
- What is the actual class balance, and does the headline metric hide it? Check the support column, not just the accuracy score, before presenting either one.
- What does a missed failure cost, compared to a false alarm? Let that ratio — not convention — decide whether you optimize for precision, recall, or an F-beta score in between.
- What physical process does this feature represent? A statistic that ignores the underlying mechanism — whether that's pressure fluctuation, thermal drift, or something else — is a guess wearing a decimal point.
In short: a model can't account for a mechanism it was never told about. The algorithm finds patterns. Domain knowledge decides which patterns are worth trusting.
ドメイン制約なしでは予知保全モデルはなぜ失敗するのか
ある機械学習エンジニアが、センサー群にまたがる異常予兆を検知するためにRandom Forest分類器を学習させた。モデルが返した数字は、一見申し分のない94.4%というaccuracyだった。誰もが満足していた——ある人が「実際の故障をいくつ検知できたのか」と尋ねるまでは。
classification reportの中に埋もれていたその答えは、ほとんどゼロに近かった。
| Class | Precision | Recall | F1-score | Support |
|---|---|---|---|---|
| 0 (normal) | 0.985 | 0.958 | 0.971 | 77,851 |
| 1 (fault A) | 0.003 | 0.013 | 0.005 | 707 |
| 2 (fault B) | 0.000 | 0.000 | 0.000 | 450 |
| accuracy | 0.944 | 79,008 | ||
| macro avg | 0.329 | 0.323 | 0.326 | 79,008 |
| weighted avg | 0.971 | 0.944 | 0.957 | 79,008 |
下段の2つの集計行が、そのギャップを如実に示している。macro avgはクラスごとのサンプル数に関係なく3つのクラスを等しく重要とみなして算出され、0.326という値になる。weighted avgは各クラスのスコアをデータ中の出現頻度で重み付けするため0.957となり、そのほとんどがnormalクラスを反映した数字になる。全体のaccuracy 94.4%は、前者よりも後者の物語に近い——そしてそれこそが問題なのだ。
モデルは、学習データの98%が正常運転の状態だったため、ほぼ毎回「normal」と予測することが低リスクな戦略だと学習してしまった。多数派クラスについてはほぼ正しく、システムが本来検知すべき少数派クラスについてはほとんど完全に誤るという形で、94.4%のaccuracyを達成していたのである。これはコーディングのミスでもモデル自体の欠陥でもない。ドメインの文脈を一切与えられないまま下されたモデリング上の意思決定であり、見出しの結果がどれほど魅力的に見えても、予知保全プロジェクトが静かに失敗する最も一般的な原因の一つである。
故障が稀な場合、accuracyは嘘をつく。
予知保全はその性質上、不均衡なデータを生み出す。なぜなら機械はほとんどの稼働時間を健全な状態で過ごすからだ。生産性と信頼性の観点からは、故障は稀なイベントでなければならない——つまり、accuracyだけを見ることは、故障を完全に無視しても高いスコアを出せてしまうモデルを許してしまうということだ。
アルゴリズムは、ドメイン知識とその問題設定の後に来るべきものである。このような不均衡なデータセットでは、precision-recall AUCの方がROC-AUCよりも誠実な指標である。なぜならROC-AUCは、真陰性(正しくnormalと識別された読み取り値)の母数の大きさによって水増しされ、モデルが実際の故障のほとんどを見逃していても、見かけ上は強いスコアに見えてしまうからだ。評価指標の選択を超えて、より深い問いに答えられるのはドメイン知識だけである——見逃した故障と誤警報とでは、どちらのコストが高いのか?ほとんどの保全の現場では、見逃した故障は二次被害、損失、計画外のダウンタイムを意味し、誤警報は何も見つからなかった点検を意味する。この非対称性こそが、precisionとrecallを等しく重要とみなすのではなく、F2 scoreを用いて故障クラスのrecallを最適化すべき理由である。
そのコスト比率を与えられるのはドメインの専門家だけであり、どんなメトリクスのライブラリもそれを教えてはくれない。
アルゴリズムはトレンドではなく、問いに従うべきである。
連続変数を予測すること、ラベルのないデータから外れ値を検知すること、ラベル付きの故障を分類すること——これらは3つの異なる問題であり、どのツールがどの仕事に属するのかを正確に見極める価値がある。
| Algorithm | What it does |
|---|---|
| ARIMA | 自己相関構造から時系列の値そのものを予測する古典的な統計モデル。「信号が次に何をするか」には答えるが、「この読み取り値が異常かどうか」には答えない。 |
| Mahalanobis distance | 変数間の相関を考慮した統計的な距離指標で、多変量の外れ値を検知するために使われる。何かを予測するためのものではなく、ラベル付きデータセットも必要としない。 |
| Random Forest | fault / no-faultといったラベル付きの事例から学習する必要がある教師あり学習のアンサンブル手法——まさに、上記のレポートで不足していたリソースそのものである。 |
| DBSCAN | 密度ベースの教師なしクラスタリングアルゴリズムで、正常運転の密な領域を必要とし、疎で孤立した点をノイズとして扱う。ラベル付きの故障事例が少なすぎて分類器を安定して学習できない場合の異常検知に有効。 |
| RNNs (incl. LSTM & GRU) | 系列的なセンサーデータに含まれる時間的依存関係を捉えるニューラルネットワークアーキテクチャ。 |
| Prophet & NeuralProphet | トレンドと季節性を持つ時系列のために設計された予測フレームワーク。NeuralProphetはProphetの加法モデルをニューラルネットワークの構成要素で拡張したもの。 |
上記の表を、互いに交換可能な「予測アルゴリズム」のメニューとして扱い、held-outの問題に対して最も性能が良いものを選ぶというやり方は、結果が本当に意味を持つかどうかを決定づける手順そのものを飛ばしてしまっている。ラベルのない異常検知の問題なのか、予測の問題なのか、それともラベル付きの分類問題なのかをまず見極めること——その区別は、アルゴリズムの人気からではなく、捕まえようとしている故障そのものを理解することから生まれる。
物理的な意味にfeature engineeringを委ねる。
特徴量を作るために適切な統計量(平均、中央値、標準偏差など)を選ぶことは、慣習の問題ではなく、背後にある物理信号がどう振る舞うかに依存する。例えば圧力は、コンプレッサーのバルブが劣化し始めても正常範囲内に収まっていることがある。なぜなら故障は多くの場合、平均値のシフトよりも先に、揺らぎの増加として現れるからだ。この場合、ローリングウィンドウにおける圧力信号の標準偏差や分散は、平均よりも多くの診断情報を持つ——平均化によって滑らかにされてしまう不安定性を捉えられるためだ。フィルターや熱交換器を挟んだ圧力差はさらに有用なことが多い。部品が詰まるにつれて上昇するdelta Pは、絶対圧力の水準とは独立に、劣化を直接示す物理的な指標だからだ。温度はまた別の振る舞いを見せる。周囲環境と負荷が変動するため、絶対値そのものはノイズの多い指標だが、ローリングウィンドウで計算した変化率dT/dtは、絶対値が固定の閾値を超えるよりも前に、進行中の故障を検知できることがある。ここを見誤ると、モデルを弱め、本来検知すべき信号そのものを平滑化してしまう。
制約は、解を複雑にするよりも単純にすることの方が多い。
故障の事例が数十件しかなく、それに対して数万件の正常な読み取り値が存在するようなデータでは、複雑なモデルが学習できる真の信号はごくわずかであり、ノイズに過学習する余地は大きい。データが豊富な分野では、手に入る最も高性能なモデルに手を伸ばすのが本能的な発想だ。しかしこの条件下では、メーカーの仕様書から導かれる圧力差の閾値、システムが置かれている環境についての知識、あるいは物理法則に基づく熱劣化モデルといった、ドメインに根ざしたアプローチの方が、必要なデータと計算量のごく一部で、ブラックボックスの分類器を上回ることがある。アラームの背後にある理屈が、不均衡なデータセットから学習された決定境界ではなく、既知の物理メカニズムまで遡れるため、人が自信を持って行動に移せるものも生み出せる。
これらはいずれも、機械学習や特定のアルゴリズムを予知保全に使うこと自体への反論ではない。反論しているのは、その出力を信頼できるものにする制約——正しい問題設定、コスト構造に見合った評価指標、そして信号が物理的に何を表しているかに根ざした特徴量——なしにアルゴリズムを導入することである。
モデルを信頼する前に、この3つの問いを立てよ。
- 実際のクラスバランスはどうなっているか、そして見出しの指標はそれを隠していないか?どちらかを提示する前に、accuracyのスコアだけでなくsupportの列を確認すること。
- 見逃した故障は、誤警報と比べてどれだけのコストを伴うのか?precision、recall、あるいはその中間のF-betaスコアのどれを最適化するかは、慣習ではなくその比率に決めさせること。
- その特徴量はどのような物理プロセスを表しているのか?圧力の揺らぎであれ、熱的なドリフトであれ、その他何であれ、背後にあるメカニズムを無視した統計量は、小数点を身にまとった当て推量にすぎない。
つまり、モデルは一度も教えられていないメカニズムを説明することはできない。アルゴリズムはパターンを見つける。どのパターンを信頼すべきかを決めるのは、ドメイン知識である。