Who Will Win the Nepal Premier League? I Simulated the Season 20,000 Times
The Nepal Premier League is three seasons old: eight franchises, one ground at Kirtipur, seven league games each and four playoff games. On 10 November 2026, with 20 of the 28 league games played, I wanted a number for a simple question: who wins it? So I built a simulator that plays out the rest of the season 10,000 times with each of two different models. Then I checked how far those models deserve to be believed.
- The question
- Given the 20 games already played, who tops the table, who makes the top four and who wins the title?
- The data
- Ball-by-ball records of all 76 NPL games on Cricsheet, about 2,750 men's T20 internationals since 2021 for player history, and the 2026 results up to 9 November.
- What you can take from it
- 1. When net run rate breaks ties, simulate whole scores, not just winners. 2. Calibrate to the venue and borrow only relative skill from elsewhere. 3. Backtest before you believe: here, team ratings did no better than a coin.
Why simulate whole scorecards
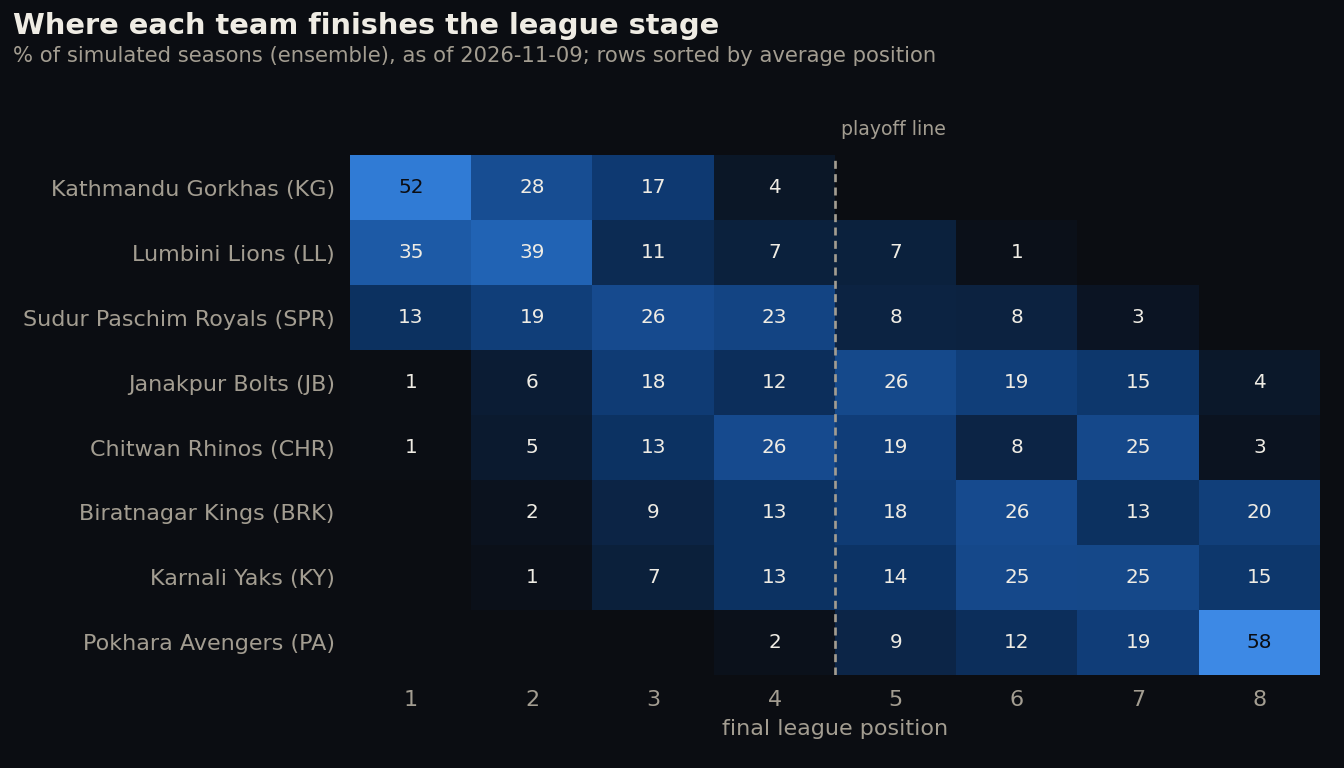
For most leagues a win probability is enough. Not in T20 cricket, where teams level on points are separated by net run rate: runs per over scored minus runs per over conceded. Losing by 2 runs and losing by 60 put you in very different places. So every simulated game produces a full score line: how many runs each side made, and in how many overs. A side bowled out counts as having faced all 20, as the playing conditions say. The top four then go through the real bracket: first v second in Qualifier 1, third v fourth in the Eliminator, then Qualifier 2 and the final.
Two ways to rate a team
The first model is Elo, the rating system from chess. Every team starts at 1500 in 2024 and gains or loses points after each game, more for a big win. Between seasons every rating is pulled a quarter of the way back to average, because NPL squads change at every auction. The size of each update and the pull-back were tuned on 2025–26.
The second model works ball by ball. Every delivery is a dot, a 1, 2, 3, 4, 6 or a wicket, with probabilities that depend on the innings, the phase (powerplay, middle overs, death), the batter and the bowler. The baseline comes only from NPL games, all played at Kirtipur, so scoring matches that ground rather than a global T20 average. Simulated first innings average 149 runs, against 148 in real NPL games.
NPL history is short, so players borrow evidence from T20 internationals. The trick is to borrow only the relative effect. A batter who scores 20% faster than average in T20Is is assumed to score 20% faster than average at Kirtipur, not to repeat his T20I numbers. Older balls count less, T20I balls count less than NPL balls, and players with little data are pulled towards average.
The forecast
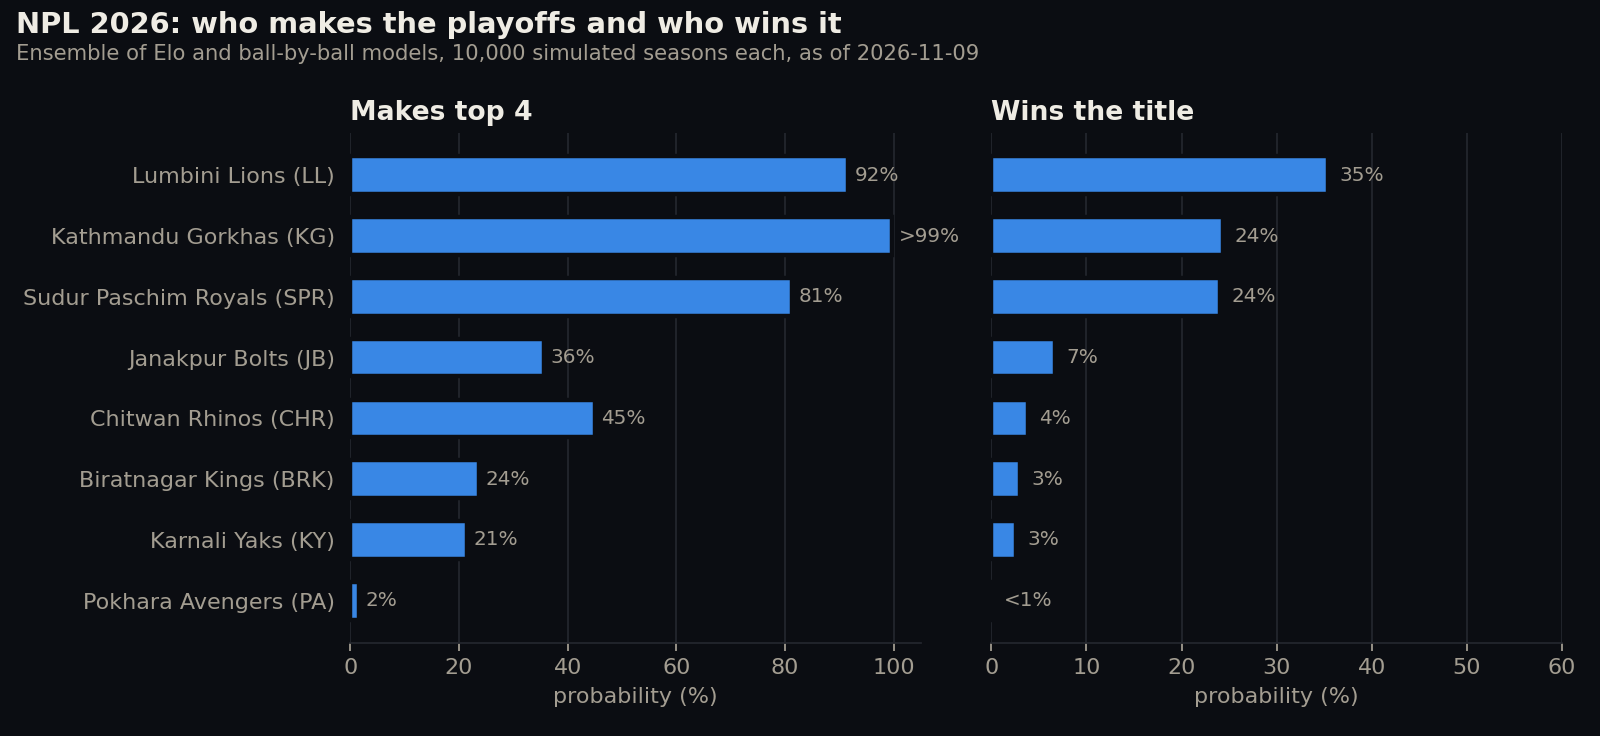
Lumbini Lions are the favourites at 35%, ahead of Kathmandu Gorkhas and Sudur Paschim Royals at 24% each. Kathmandu are all but certain of a playoff place (over 99%), Lumbini are at 92% and Sudur Paschim at 81%. The fourth place is open between Chitwan (45%), Janakpur (36%), Biratnagar (24%) and Karnali (21%). Pokhara need something close to a miracle.
Where the models disagree
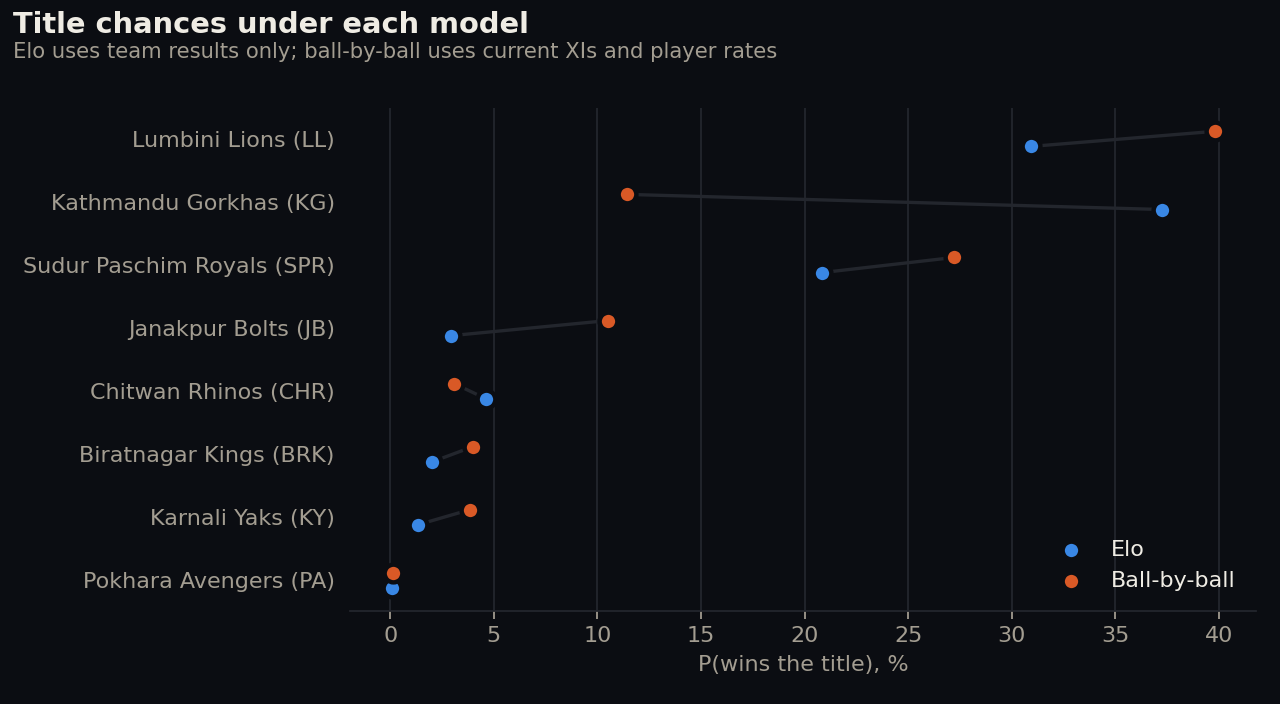
The two models agree on most teams. Not on Kathmandu. Their 4–1 start gives them a 37% title chance under Elo. The ball-by-ball model gives them 11%: most of their current XI has little recorded T20 data, so it sees an average side that has been winning a lot. Before the season it gave them 1%, the lowest of all eight. One of the two models is wrong about Kathmandu, and five games are not enough to say which. The headline splits the difference.
How much should you believe it?
I predicted every NPL game from 2025 and 2026 that has a ball-by-ball record (44 games), using only data from before that day. For the ball-by-ball model I also gave it the two real XIs and batting orders.
| Model | Log loss | Brier |
|---|---|---|
| Coin flip | 0.693 | 0.250 |
| Elo | 0.693 | 0.250 |
| Ball-by-ball | 0.688 | 0.248 |
| Average of both | 0.687 | 0.247 |
Elo did no better than flipping a coin. The ball-by-ball model and the average of the two did a little better, but only a little. Either the NPL has so far been close to a lottery, or 44 games are too few to tell a good model from a lucky one. Probably both. That is why no team is above 35%, and why I would read 35% as "favourite", not as "likely".
A forecast without a backtest is an opinion with decimals.
The data check that paid off
Cricsheet's records stop at 3 November, so I typed the later results in by hand from Wikipedia. Before trusting them, I compared the 13 games that appear in both sources run for run and ball for ball, and rebuilt the points table to compare with the published one. That caught one error in my first version: the chase in match 11 had been entered as 20 overs, and the ball-by-ball record says 16.4. It also showed that the published net run rates for Kathmandu and Chitwan had not yet been updated for their game on 9 November, though the points had. Small things, but net run rate decides places.
What it doesn't know
- Line-ups are fixed. Each team plays its latest recorded XI, plus three players who joined later and were added by hand. Injuries and rotation are not modelled.
- Batters don't adapt. Nobody speeds up when the asking rate climbs, so simulated chases succeed a little too often (54% against 50% in real NPL games).
- No playoff washouts. Weather can wipe out a league game (a 1.9% chance, from the NPL's own record), but not a knockout.
What I'd take from it
- When the tie-break is net run rate, simulate scores, not just winners.
- Calibrate to the place, and borrow only relative skill from other competitions.
- Run the backtest before the forecast goes out. Here it turned "Elo says" into "a coin says".
- Check hand-entered data against a second source. Reconciling with the published table found an error in an afternoon.
This forecast is a snapshot from 10 November; the final is on 21 November. The code, data sources and every number on this page are in the repository. It is the cricket sibling of my World Cup 2026 forecast, which simulated that tournament 100,000 times.
ネパール・プレミアリーグを制するのはどこか? シーズンを2万回シミュレーションした
ネパール・プレミアリーグ(NPL)は今年で3シーズン目のT20クリケットリーグです。8チーム、会場はキルティプルの1か所のみ、リーグ戦は各チーム7試合、その後にプレーオフが4試合。2026年11月10日、リーグ戦28試合のうち20試合が終わった時点で、「どこが優勝するのか」という単純な問いに数字で答えたくなりました。そこで、残りのシーズンを2つの異なるモデルでそれぞれ1万回ずつ再現するシミュレーターを作り、そのモデルをどこまで信じてよいかも検証しました。
- 問い
- すでに終わった20試合を前提に、どのチームが首位になり、上位4チームに入り、優勝するのか。
- データ
- CricsheetにあるNPL全76試合の1球ごとの記録、選手の過去実績として2021年以降の男子T20国際試合 約2,750試合、そして11月9日までの2026年シーズンの結果。
- ここから持ち帰れること
- 1. 同率の順位をネットランレートで決めるなら、勝敗だけでなくスコアごとシミュレーションする。2. 会場に合わせて較正し、他の大会からは「相対的な実力」だけを借りる。3. 信じる前にバックテストする。今回、チームのレーティングはコイン投げと変わりませんでした。
なぜスコアカードごと再現するのか
多くのリーグでは勝率さえわかれば十分です。しかしT20クリケットでは、勝ち点が並んだチームをネットランレート(1オーバーあたりの得点 − 1オーバーあたりの失点)で分けます。2点差の負けと60点差の負けでは、順位表での立場がまったく違います。そこで、シミュレーションする各試合で両チームの得点と消化オーバー数まで出し、オールアウトの場合は規定どおり20オーバーを消化したものとして扱いました。上位4チームは実際の方式どおり、クオリファイア1(1位対2位)、エリミネーター(3位対4位)、クオリファイア2、決勝へと進みます。
チームを評価する2つの方法
1つ目のモデルは、チェスで使われるレーティング方式のEloです。全チームが2024年に1500から始まり、試合ごとに点数が増減します。大差で勝つほど大きく動きます。NPLはオークションのたびに選手が大きく入れ替わるため、シーズンの合間には各チームのレーティングを平均へ4分の1だけ戻しています。更新の大きさと戻す割合は2025〜26年の試合で調整しました。
2つ目のモデルは1球単位で動きます。各投球は0・1・2・3・4・6点かウィケットのいずれかで、その確率はイニング、局面(パワープレー・中盤・終盤)、打者、投手によって変わります。基準となる確率はNPLの試合だけから求めました。NPLは全試合キルティプルで行われるので、得点水準は世界のT20平均ではなく、このグラウンドに合ったものになります。シミュレーション上の1イニング目の平均は149点、実際のNPLは148点でした。
NPLの歴史は短いので、選手の実力はT20国際試合からも借りています。ポイントは「相対的な効果」だけを借りることです。T20国際試合で平均より20%速く得点する打者は、キルティプルでも平均より20%速く得点すると考え、国際試合の数字そのものは持ち込みません。古い投球ほど、また国際試合の投球はNPLの投球より軽く扱い、データの少ない選手は平均に寄せています。
予測結果
優勝候補の筆頭はLumbini Lionsで35%。Kathmandu GorkhasとSudur Paschim Royalsがともに24%で続きます。プレーオフ進出はKathmanduがほぼ確実(99%超)、Lumbiniが92%、Sudur Paschimが81%。残る1枠はChitwan(45%)、Janakpur(36%)、Biratnagar(24%)、Karnali(21%)の争いです。Pokharaには奇跡に近いものが必要です。
2つのモデルが食い違うところ
ほとんどのチームについて、2つのモデルの見方は一致します。例外はKathmanduです。4勝1敗のスタートにより、Eloでは優勝確率37%。一方、1球単位のモデルでは11%です。現在の先発メンバーの多くはT20の記録が少ないため、このモデルには「よく勝っている平均的なチーム」に見えるのです。シーズン前の評価は1%で、8チーム中最低でした。どちらかのモデルがKathmanduを読み違えていますが、5試合ではどちらかを判断できません。見出しの数字は両者の中間をとっています。
この予測はどこまで信じられるか
1球ごとの記録がある2025年と2026年のNPL全44試合を、それぞれ試合当日より前のデータだけで予測しました。1球単位のモデルには、実際の両チームの先発11人と打順も与えています。
| モデル | Log loss | Brier |
|---|---|---|
| コイン投げ | 0.693 | 0.250 |
| Elo | 0.693 | 0.250 |
| 1球単位 | 0.688 | 0.248 |
| 両モデルの平均 | 0.687 | 0.247 |
Eloはコイン投げと同じ成績でした。1球単位のモデルと両者の平均はわずかに上回りましたが、本当にわずかです。NPLがこれまでほぼくじ引きのようなリーグだったのか、44試合では良いモデルと運の良いモデルを見分けられないのか。おそらくその両方です。どのチームも35%を超えないのはそのためで、35%は「本命」であって「優勝しそう」という意味ではありません。
バックテストのない予測は、小数点つきの意見にすぎない。
データ確認が役に立った場面
Cricsheetの記録は11月3日で止まっているため、それ以降の結果はWikipediaから手で入力しました。信じる前に、両方の情報源にある13試合を得点・投球単位で突き合わせ、順位表を作り直して公表されているものと比べました。これで最初の版の誤りが1つ見つかりました。第11試合の追う側のイニングが20オーバーと入力されていましたが、1球ごとの記録では16.4オーバーでした。また、公表されているKathmanduとChitwanのネットランレートには11月9日の試合がまだ反映されておらず、勝ち点だけが更新されていたこともわかりました。細かいことですが、順位を決めるのはネットランレートです。
このモデルが知らないこと
- メンバーは固定です。各チームは記録上の最新の先発11人で戦い、その後に加わった3選手は手作業で追加しました。けがやローテーションは考慮していません。
- 打者は状況に合わせません。必要な得点ペースが上がっても誰も攻撃的にならないため、追う側の勝率がやや高めに出ます(実際のNPLの50%に対し54%)。
- プレーオフは雨で流れません。リーグ戦はNPL自身の記録から1.9%の確率で中止になりますが、決勝トーナメントは必ず決着します。
ここから持ち帰れること
- 同率の順位をネットランレートで決めるなら、勝者だけでなくスコアをシミュレーションする。
- その場所に合わせて較正し、他の大会からは相対的な実力だけを借りる。
- 予測を出す前にバックテストする。今回は「Eloによれば」が「コインによれば」に変わりました。
- 手入力したデータは別の情報源と照合する。公表された順位表と突き合わせるだけで、午後のうちに誤りが見つかりました。
この予測は11月10日時点のスナップショットで、決勝は11月21日です。コード、データの出典、このページのすべての数字はリポジトリにあります。ワールドカップ2026を10万回シミュレーションした予測プロジェクトの、クリケット版の兄弟にあたります。